PRERANA KAMAT
BUILDING SIMULATION IN DESIGN PRACTICE
Location- New York, NY
Instructors- Roya Razaee, Marcelo Bernal, Tyrone Marshall, Perkins & Will
Term- Spring 2020
Team members- Kiran Golla Prerana Kamat
Softwares used- Rhino, Grasshopper, JMP data analysis
Simulation Tool- Butterfly, Honeybee, Ladybug, Octopus, Galapagos
This modeling and simulation course the following domains: Parametric Modeling, Solar, Energy, Air Flow and Ventilation, Daylighting, View, Statistical Analysis, and Data Visualization. computational techniques to generate a large space of design options, simulate a variety of building performances, evaluate and explore the options, and make informed design decisions in a systematic framework called Design Space Construction (DSC) that was developed at Perkins & Will.

The first strand of the course dealt with fundamental knowledge of building modeling and simulation use of parametric tools and introduction to techniques of multi-criteria optimization tested on 799 Broadway Building by Perkins and Will.

PROGRAM AND SPECIFICATION
-
40.732362, -73.991485
-
Broadway St, Greenwich Village,
-
Manhattan, New York
-
The 168,645-square-foot structure
-
Retail on the ground and sub-grade levels.
-
Offices on upper floors

The second strand comprised of a self-initiated design project focused on the development of an integrated model and the application of a realistic design decision making process.
Working in a team, we first formulated the research questions, investigated precedents, and constructed parametric relationships that described the geometry and program configuration using DSC. We then evaluated the design options for multiple objectives, analyzed and visualized the data, extracted the insights, and formulated guidelines for design.
PRECEDENT INVESTIGATION
i. VIEW ANALYSIS
About 82.52% ( 79812 m2 ) of the facade lies between a view range of 0-20% to the set target point
The remaining 17.48% lies in the 20-40% view range

Area within 0-20% =79812 m2 = 82.52%
Area within 20-40% =16911m2 = 17.48%
Area within 40-60% = 0 %
Area within 60-80% = 0 %
Area within 80-100% = 0 %

Set Target
ii. USEFUL DAYLIGHT ILLUMINANCE (UDI)


UDI below 300lux-
81% of the area
UDI above 3000lux - 2% of the area
UDI below 300-3000lux- 17% of the area
iii. ENERGY USE INTENSITY (EUI)


OBJECTIVE FORMULATION


To achieve the objectives of Maximum View and UDI, Minimum EUI, Window to wall Ratio in the North and East facade, Glazing VLT ( the amount of visible light waves that transmit through a material ) and Stacking options are set as input parameters.
Stacking Options are changed such that the area remains constant while the dimensions of the floor plates are varied. The below animations show the concept thus used on a rectangular plate and how the same is applied on the building.
QUANTIFICATION OF FULL FACTORIAL DESIGN SPACE

REDUCTION OF DESIGN SPACE USING DoE

The Full factorial of 256 runs is reduced to 16 using DoE which gives a random and varied set of choices using which the analysis is performed

OBJECTIVE 1 : VIEW ANALYSIS
The Set Target point is the same as that of the Precedent's. The analysis is run on the 4 Stacking options which have 15, 18, 21, 24ft offsets.
Run 1 with 15ft produces the best result among the options.

OBJECTIVE 2 : UDI
OBJECTIVE 2 : UDI
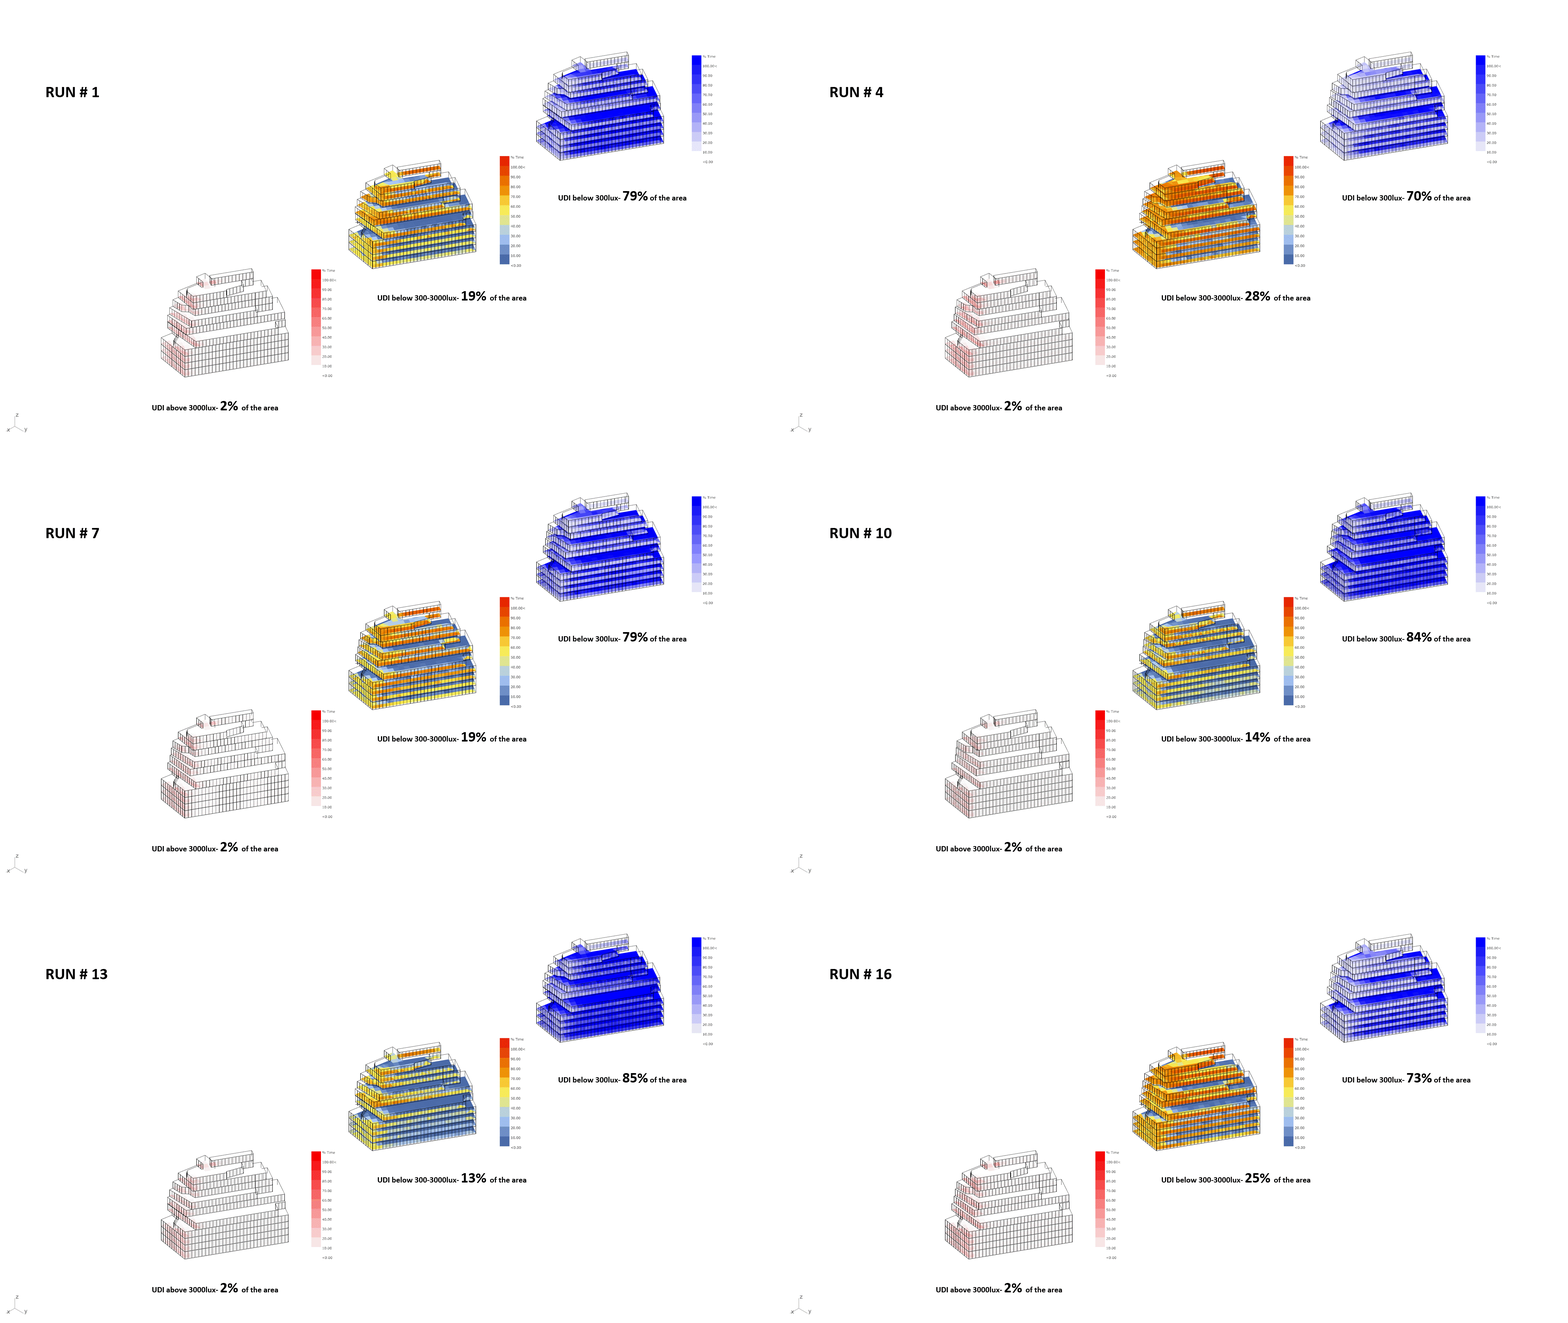
UDI is then run for the 16 different options which have varied input parameters of WWR, Stacking and Glazing VLT.
OBJECTIVE 3 : EUI


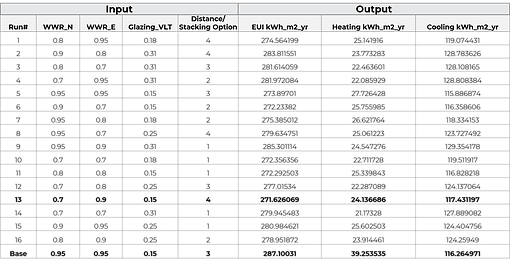
Using the Input Parameters listed below, the Outputs are generated using the grasshopper / honeybee script from which we can notice that the 3th run produces the best output.
SENSITIVITY ANALYSIS
After running the view analysis, UDI and EUI for the 16 iterations/ runs, the model is then taken to PCP / Jmp software to analyse the effect of each of the considered design alternative on the model or understand its sensitivity to the parameters under consideration. The following visuals from the prediction profiler help in understanding the model's sensitivity to each input parameter.


These graphs represent that the UDI and EUI of the building are highly sensitive to the Glazing VLT input while the other inputs like WWR and stack option have little or no effect on these objectives.

On the other hand, the percentage of area for the view analysis is only sensitive to the stack options while the Glazing VLT and the WWR have no effect.
CONFLICTING OBJECTIVES

VALUE ASSESSMENT
Due to the conflicting objectives the data is then normalized/ given a rating from 0-1 such that their outputs become comparable. This data is then evaluated in order to recommend a best case scenario where the weightage /priority on UDI and EUI is 40% each and View is 20%. The below Parallel coordinates plot (PCP) is obtained by uploading the data into Design Explorer

RECOMMENDATION BASED ON OBJECTIVES- RUN#12


The value assessment therefore proves that having lower window to wall ratio on north and east sides and increasing the Glazing VLT to 0.21 while having the stack option to match the original building, helps in achieving the best case scenario within the design space.